#Kubernetes Cluster Efficiency
Explore tagged Tumblr posts
Visit Tumblr Blog
Explore Tumblr blogs with no restrictions, modern design and the best experience.
Last Seen Tumblr Blogs


Fun Fact
There were a total of 171.5 billion posts on Tumblr in 2019.
Text
k0s vs k3s - Battle of the Tiny Kubernetes distros
k0s vs k3s - Battle of the Tiny Kubernetes distros #100daysofhomelab #homelab @vexpert #vmwarecommunities #KubernetesDistributions, #k0svsk3s, #RunningKubernetes, #LightweightKubernetes, #KubernetesInEdgeComputing, #KubernetesInBareMetal
Kubernetes has redefined the management of containerized applications. The rich ecosystem of Kubernetes distributions testifies to its widespread adoption and versatility. Today, we compare k0s vs k3s, two unique Kubernetes distributions designed to seamlessly run Kubernetes across varied infrastructures, from cloud instances to bare metal and edge computing settings. Those with home labs will…

View On WordPress
#k0s vs k3s#Kubernetes Cluster Efficiency#Kubernetes distributions#Kubernetes for Production Workloads#Kubernetes in Bare Metal#Kubernetes in Cloud Instances#Kubernetes in Edge Computing#Kubernetes on Virtual Machines#Lightweight Kubernetes#Running Kubernetes
0 notes
Text
Load Balancing Web Sockets with K8s/Istio
When load balancing WebSockets in a Kubernetes (K8s) environment with Istio, there are several considerations to ensure persistent, low-latency connections. WebSockets require special handling because they are long-lived, bidirectional connections, which are different from standard HTTP request-response communication. Here’s a guide to implementing load balancing for WebSockets using Istio.
1. Enable WebSocket Support in Istio
By default, Istio supports WebSocket connections, but certain configurations may need tweaking. You should ensure that:
Destination rules and VirtualServices are configured appropriately to allow WebSocket traffic.
Example VirtualService Configuration.
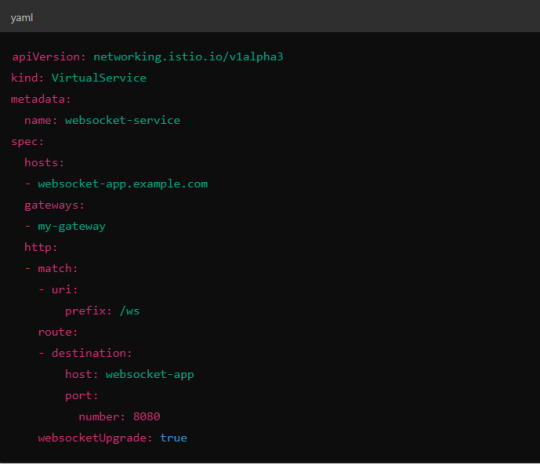
Here, websocketUpgrade: true explicitly allows WebSocket traffic and ensures that Istio won’t downgrade the WebSocket connection to HTTP.
2. Session Affinity (Sticky Sessions)
In WebSocket applications, sticky sessions or session affinity is often necessary to keep long-running WebSocket connections tied to the same backend pod. Without session affinity, WebSocket connections can be terminated if the load balancer routes the traffic to a different pod.
Implementing Session Affinity in Istio.
Session affinity is typically achieved by setting the sessionAffinity field to ClientIP at the Kubernetes service level.
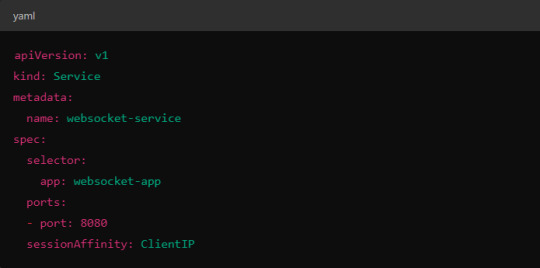
In Istio, you might also control affinity using headers. For example, Istio can route traffic based on headers by configuring a VirtualService to ensure connections stay on the same backend.
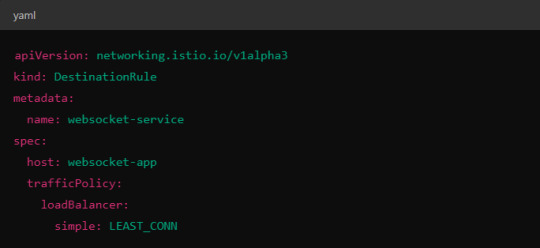
3. Load Balancing Strategy
Since WebSocket connections are long-lived, round-robin or random load balancing strategies can lead to unbalanced workloads across pods. To address this, you may consider using least connection or consistent hashing algorithms to ensure that existing connections are efficiently distributed.
Load Balancer Configuration in Istio.
Istio allows you to specify different load balancing strategies in the DestinationRule for your services. For WebSockets, the LEAST_CONN strategy may be more appropriate.
Alternatively, you could use consistent hashing for a more sticky routing based on connection properties like the user session ID.
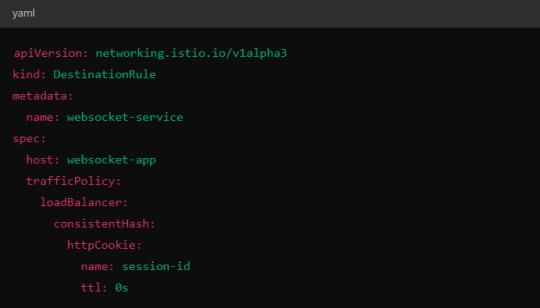
This configuration ensures that connections with the same session ID go to the same pod.
4. Scaling Considerations
WebSocket applications can handle a large number of concurrent connections, so you’ll need to ensure that your Kubernetes cluster can scale appropriately.
Horizontal Pod Autoscaler (HPA): Use an HPA to automatically scale your pods based on metrics like CPU, memory, or custom metrics such as open WebSocket connections.
Istio Autoscaler: You may also scale Istio itself to handle the increased load on the control plane as WebSocket connections increase.
5. Connection Timeouts and Keep-Alive
Ensure that both your WebSocket clients and the Istio proxy (Envoy) are configured for long-lived connections. Some settings that need attention:
Timeouts: In VirtualService, make sure there are no aggressive timeout settings that would prematurely close WebSocket connections.

Keep-Alive Settings: You can also adjust the keep-alive settings at the Envoy level if necessary. Envoy, the proxy used by Istio, supports long-lived WebSocket connections out-of-the-box, but custom keep-alive policies can be configured.
6. Ingress Gateway Configuration
If you're using an Istio Ingress Gateway, ensure that it is configured to handle WebSocket traffic. The gateway should allow for WebSocket connections on the relevant port.

This configuration ensures that the Ingress Gateway can handle WebSocket upgrades and correctly route them to the backend service.
Summary of Key Steps
Enable WebSocket support in Istio’s VirtualService.
Use session affinity to tie WebSocket connections to the same backend pod.
Choose an appropriate load balancing strategy, such as least connection or consistent hashing.
Set timeouts and keep-alive policies to ensure long-lived WebSocket connections.
Configure the Ingress Gateway to handle WebSocket traffic.
By properly configuring Istio, Kubernetes, and your WebSocket service, you can efficiently load balance WebSocket connections in a microservices architecture.
#kubernetes#websockets#Load Balancing#devops#linux#coding#programming#Istio#virtualservices#Load Balancer#Kubernetes cluster#gateway#python#devlog#github#ansible
5 notes
·
View notes
Text
Enterprise Kubernetes Storage with Red Hat OpenShift Data Foundation (DO370)
In the era of cloud-native transformation, data is the fuel powering everything from mission-critical enterprise apps to real-time analytics platforms. However, as Kubernetes adoption grows, many organizations face a new set of challenges: how to manage persistent storage efficiently, reliably, and securely across distributed environments.
To solve this, Red Hat OpenShift Data Foundation (ODF) emerges as a powerful solution — and the DO370 training course is designed to equip professionals with the skills to deploy and manage this enterprise-grade storage platform.
🔍 What is Red Hat OpenShift Data Foundation?
OpenShift Data Foundation is an integrated, software-defined storage solution that delivers scalable, resilient, and cloud-native storage for Kubernetes workloads. Built on Ceph and Rook, ODF supports block, file, and object storage within OpenShift, making it an ideal choice for stateful applications like databases, CI/CD systems, AI/ML pipelines, and analytics engines.
🎯 Why Learn DO370?
The DO370: Red Hat OpenShift Data Foundation course is specifically designed for storage administrators, infrastructure architects, and OpenShift professionals who want to:
✅ Deploy ODF on OpenShift clusters using best practices.
✅ Understand the architecture and internal components of Ceph-based storage.
✅ Manage persistent volumes (PVs), storage classes, and dynamic provisioning.
✅ Monitor, scale, and secure Kubernetes storage environments.
✅ Troubleshoot common storage-related issues in production.
🛠️ Key Features of ODF for Enterprise Workloads
1. Unified Storage (Block, File, Object)
Eliminate silos with a single platform that supports diverse workloads.
2. High Availability & Resilience
ODF is designed for fault tolerance and self-healing, ensuring business continuity.
3. Integrated with OpenShift
Full integration with the OpenShift Console, Operators, and CLI for seamless Day 1 and Day 2 operations.
4. Dynamic Provisioning
Simplifies persistent storage allocation, reducing manual intervention.
5. Multi-Cloud & Hybrid Cloud Ready
Store and manage data across on-prem, public cloud, and edge environments.
📘 What You Will Learn in DO370
Installing and configuring ODF in an OpenShift environment.
Creating and managing storage resources using the OpenShift Console and CLI.
Implementing security and encryption for data at rest.
Monitoring ODF health with Prometheus and Grafana.
Scaling the storage cluster to meet growing demands.
🧠 Real-World Use Cases
Databases: PostgreSQL, MySQL, MongoDB with persistent volumes.
CI/CD: Jenkins with persistent pipelines and storage for artifacts.
AI/ML: Store and manage large datasets for training models.
Kafka & Logging: High-throughput storage for real-time data ingestion.
👨🏫 Who Should Enroll?
This course is ideal for:
Storage Administrators
Kubernetes Engineers
DevOps & SRE teams
Enterprise Architects
OpenShift Administrators aiming to become RHCA in Infrastructure or OpenShift
🚀 Takeaway
If you’re serious about building resilient, performant, and scalable storage for your Kubernetes applications, DO370 is the must-have training. With ODF becoming a core component of modern OpenShift deployments, understanding it deeply positions you as a valuable asset in any hybrid cloud team.
🧭 Ready to transform your Kubernetes storage strategy? Enroll in DO370 and master Red Hat OpenShift Data Foundation today with HawkStack Technologies – your trusted Red Hat Certified Training Partner. For more details www.hawkstack.com
0 notes
Text
Unlocking SRE Success: Roles and Responsibilities That Matter
In today’s digitally driven world, ensuring the reliability and performance of applications and systems is more critical than ever. This is where Site Reliability Engineering (SRE) plays a pivotal role. Originally developed by Google, SRE is a modern approach to IT operations that focuses strongly on automation, scalability, and reliability.

But what exactly do SREs do? Let’s explore the key roles and responsibilities of a Site Reliability Engineer and how they drive reliability, performance, and efficiency in modern IT environments.
🔹 What is a Site Reliability Engineer (SRE)?
A Site Reliability Engineer is a professional who applies software engineering principles to system administration and operations tasks. The main goal is to build scalable and highly reliable systems that function smoothly even during high demand or failure scenarios.
🔹 Core SRE Roles
SREs act as a bridge between development and operations teams. Their core responsibilities are usually grouped under these key roles:
1. Reliability Advocate
Ensures high availability and performance of services
Implements Service Level Objectives (SLOs), Service Level Indicators (SLIs), and Service Level Agreements (SLAs)
Identifies and removes reliability bottlenecks
2. Automation Engineer
Automates repetitive manual tasks using tools and scripts
Builds CI/CD pipelines for smoother deployments
Reduces human error and increases deployment speed
3. Monitoring & Observability Expert
Sets up real-time monitoring tools like Prometheus, Grafana, and Datadog
Implements logging, tracing, and alerting systems
Proactively detects issues before they impact users
4. Incident Responder
Handles outages and critical incidents
Leads root cause analysis (RCA) and postmortems
Builds incident playbooks for faster recovery
5. Performance Optimizer
Analyzes system performance metrics
Conducts load and stress testing
Optimizes infrastructure for cost and performance
6. Security and Compliance Enforcer
Implements security best practices in infrastructure
Ensures compliance with industry standards (e.g., ISO, GDPR)
Coordinates with security teams for audits and risk management
7. Capacity Planner
Forecasts traffic and resource needs
Plans for scaling infrastructure ahead of demand
Uses tools for autoscaling and load balancing
🔹 Day-to-Day Responsibilities of an SRE
Here are some common tasks SREs handle daily:
Deploying code with zero downtime
Troubleshooting production issues
Writing automation scripts to streamline operations
Reviewing infrastructure changes
Managing Kubernetes clusters or cloud services (AWS, GCP, Azure)
Performing system upgrades and patches
Running game days or chaos engineering practices to test resilience
🔹 Tools & Technologies Commonly Used by SREs
Monitoring: Prometheus, Grafana, ELK Stack, Datadog
Automation: Terraform, Ansible, Chef, Puppet
CI/CD: Jenkins, GitLab CI, ArgoCD
Containers & Orchestration: Docker, Kubernetes
Cloud Platforms: AWS, Google Cloud, Microsoft Azure
Incident Management: PagerDuty, Opsgenie, VictorOps
🔹 Why SRE Matters for Modern Businesses
Reduces system downtime and increases user satisfaction
Improves deployment speed without compromising reliability
Enables proactive problem solving through observability
Bridges the gap between developers and operations
Drives cost-effective scaling and infrastructure optimization
🔹 Final Thoughts
Site Reliability Engineering roles and responsibilities are more than just monitoring systems—it’s about building a resilient, scalable, and efficient infrastructure that keeps digital services running smoothly. With a blend of coding, systems knowledge, and problem-solving skills, SREs play a crucial role in modern DevOps and cloud-native environments.
📥 Click Here: Site Reliability Engineering certification training program
0 notes
Text
Kubernetes Tutorials | Waytoeasylearn
Learn how to become a Certified Kubernetes Administrator (CKA) with this all-in-one Kubernetes course. It is suitable for complete beginners as well as experienced DevOps engineers. This practical, hands-on class will teach you how to understand Kubernetes architecture, deploy and manage applications, scale services, troubleshoot issues, and perform admin tasks. It covers everything you need to confidently pass the CKA exam and run containerized apps in production.
Learn Kubernetes the easy way! 🚀 Best tutorials at Waytoeasylearn for mastering Kubernetes and cloud computing efficiently.➡️ Learn Now

Whether you are studying for the CKA exam or want to become a Kubernetes expert, this course offers step-by-step lessons, real-life examples, and labs focused on exam topics. You will learn from Kubernetes professionals and gain skills that employers are looking for.
Key Learning Outcomes: Understand Kubernetes architecture, components, and key ideas. Deploy, scale, and manage containerized apps on Kubernetes clusters. Learn to use kubectl, YAML files, and troubleshoot clusters. Get familiar with pods, services, deployments, volumes, namespaces, and RBAC. Set up and run production-ready Kubernetes clusters using kubeadm. Explore advanced topics like rolling updates, autoscaling, and networking. Build confidence with real-world labs and practice exams. Prepare for the CKA exam with helpful tips, checklists, and practice scenarios.
Who Should Take This Course: Aspiring CKA candidates. DevOps engineers, cloud engineers, and system admins. Software developers moving into cloud-native work. Anyone who wants to master Kubernetes for real jobs.
1 note
·
View note
Text
Kubernetes Cluster Management at Scale: Challenges and Solutions
As Kubernetes has become the cornerstone of modern cloud-native infrastructure, managing it at scale is a growing challenge for enterprises. While Kubernetes excels in orchestrating containers efficiently, managing multiple clusters across teams, environments, and regions presents a new level of operational complexity.
In this blog, we’ll explore the key challenges of Kubernetes cluster management at scale and offer actionable solutions, tools, and best practices to help engineering teams build scalable, secure, and maintainable Kubernetes environments.
Why Scaling Kubernetes Is Challenging
Kubernetes is designed for scalability—but only when implemented with foresight. As organizations expand from a single cluster to dozens or even hundreds, they encounter several operational hurdles.
Key Challenges:
1. Operational Overhead
Maintaining multiple clusters means managing upgrades, backups, security patches, and resource optimization—multiplied by every environment (dev, staging, prod). Without centralized tooling, this overhead can spiral quickly.
2. Configuration Drift
Cluster configurations often diverge over time, causing inconsistent behavior, deployment errors, or compliance risks. Manual updates make it difficult to maintain consistency.
3. Observability and Monitoring
Standard logging and monitoring solutions often fail to scale with the ephemeral and dynamic nature of containers. Observability becomes noisy and fragmented without standardization.
4. Resource Isolation and Multi-Tenancy
Balancing shared infrastructure with security and performance for different teams or business units is tricky. Kubernetes namespaces alone may not provide sufficient isolation.
5. Security and Policy Enforcement
Enforcing consistent RBAC policies, network segmentation, and compliance rules across multiple clusters can lead to blind spots and misconfigurations.
Best Practices and Scalable Solutions
To manage Kubernetes at scale effectively, enterprises need a layered, automation-driven strategy. Here are the key components:
1. GitOps for Declarative Infrastructure Management
GitOps leverages Git as the source of truth for infrastructure and application deployment. With tools like ArgoCD or Flux, you can:
Apply consistent configurations across clusters.
Automatically detect and rollback configuration drifts.
Audit all changes through Git commit history.
Benefits:
· Immutable infrastructure
· Easier rollbacks
· Team collaboration and visibility
2. Centralized Cluster Management Platforms
Use centralized control planes to manage the lifecycle of multiple clusters. Popular tools include:
Rancher – Simplified Kubernetes management with RBAC and policy controls.
Red Hat OpenShift – Enterprise-grade PaaS built on Kubernetes.
VMware Tanzu Mission Control – Unified policy and lifecycle management.
Google Anthos / Azure Arc / Amazon EKS Anywhere – Cloud-native solutions with hybrid/multi-cloud support.
Benefits:
· Unified view of all clusters
· Role-based access control (RBAC)
· Policy enforcement at scale
3. Standardization with Helm, Kustomize, and CRDs
Avoid bespoke configurations per cluster. Use templating and overlays:
Helm: Define and deploy repeatable Kubernetes manifests.
Kustomize: Customize raw YAMLs without forking.
Custom Resource Definitions (CRDs): Extend Kubernetes API to include enterprise-specific configurations.
Pro Tip: Store and manage these configurations in Git repositories following GitOps practices.
4. Scalable Observability Stack
Deploy a centralized observability solution to maintain visibility across environments.
Prometheus + Thanos: For multi-cluster metrics aggregation.
Grafana: For dashboards and alerting.
Loki or ELK Stack: For log aggregation.
Jaeger or OpenTelemetry: For tracing and performance monitoring.
Benefits:
· Cluster health transparency
· Proactive issue detection
· Developer fliendly insights
5. Policy-as-Code and Security Automation
Enforce security and compliance policies consistently:
OPA + Gatekeeper: Define and enforce security policies (e.g., restrict container images, enforce labels).
Kyverno: Kubernetes-native policy engine for validation and mutation.
Falco: Real-time runtime security monitoring.
Kube-bench: Run CIS Kubernetes benchmark checks automatically.
Security Tip: Regularly scan cluster and workloads using tools like Trivy, Kube-hunter, or Aqua Security.
6. Autoscaling and Cost Optimization
To avoid resource wastage or service degradation:
Horizontal Pod Autoscaler (HPA) – Auto-scales pods based on metrics.
Vertical Pod Autoscaler (VPA) – Adjusts container resources.
Cluster Autoscaler – Scales nodes up/down based on workload.
Karpenter (AWS) – Next-gen open-source autoscaler with rapid provisioning.
Conclusion
As Kubernetes adoption matures, organizations must rethink their management strategy to accommodate growth, reliability, and governance. The transition from a handful of clusters to enterprise-wide Kubernetes infrastructure requires automation, observability, and strong policy enforcement.
By adopting GitOps, centralized control planes, standardized templates, and automated policy tools, enterprises can achieve Kubernetes cluster management at scale—without compromising on security, reliability, or developer velocity.
0 notes
Text

Comparison of Ubuntu, Debian, and Yocto for IIoT and Edge Computing
In industrial IoT (IIoT) and edge computing scenarios, Ubuntu, Debian, and Yocto Project each have unique advantages. Below is a detailed comparison and recommendations for these three systems:
1. Ubuntu (ARM)
Advantages
Ready-to-use: Provides official ARM images (e.g., Ubuntu Server 22.04 LTS) supporting hardware like Raspberry Pi and NVIDIA Jetson, requiring no complex configuration.
Cloud-native support: Built-in tools like MicroK8s, Docker, and Kubernetes, ideal for edge-cloud collaboration.
Long-term support (LTS): 5 years of security updates, meeting industrial stability requirements.
Rich software ecosystem: Access to AI/ML tools (e.g., TensorFlow Lite) and databases (e.g., PostgreSQL ARM-optimized) via APT and Snap Store.
Use Cases
Rapid prototyping: Quick deployment of Python/Node.js applications on edge gateways.
AI edge inference: Running computer vision models (e.g., ROS 2 + Ubuntu) on Jetson devices.
Lightweight K8s clusters: Edge nodes managed by MicroK8s.
Limitations
Higher resource usage (minimum ~512MB RAM), unsuitable for ultra-low-power devices.
2. Debian (ARM)
Advantages
Exceptional stability: Packages undergo rigorous testing, ideal for 24/7 industrial operation.
Lightweight: Minimal installation requires only 128MB RAM; GUI-free versions available.
Long-term support: Up to 10+ years of security updates via Debian LTS (with commercial support).
Hardware compatibility: Supports older or niche ARM chips (e.g., TI Sitara series).
Use Cases
Industrial controllers: PLCs, HMIs, and other devices requiring deterministic responses.
Network edge devices: Firewalls, protocol gateways (e.g., Modbus-to-MQTT).
Critical systems (medical/transport): Compliance with IEC 62304/DO-178C certifications.
Limitations
Older software versions (e.g., default GCC version); newer features require backports.
3. Yocto Project
Advantages
Full customization: Tailor everything from kernel to user space, generating minimal images (<50MB possible).
Real-time extensions: Supports Xenomai/Preempt-RT patches for μs-level latency.
Cross-platform portability: Single recipe set adapts to multiple hardware platforms (e.g., NXP i.MX6 → i.MX8).
Security design: Built-in industrial-grade features like SELinux and dm-verity.
Use Cases
Custom industrial devices: Requires specific kernel configurations or proprietary drivers (e.g., CAN-FD bus support).
High real-time systems: Robotic motion control, CNC machines.
Resource-constrained terminals: Sensor nodes running lightweight stacks (e.g., Zephyr+FreeRTOS hybrid deployment).
Limitations
Steep learning curve (BitBake syntax required); longer development cycles.
4. Comparison Summary
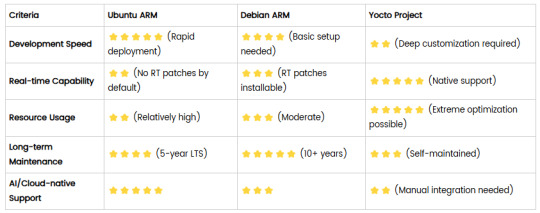
5. Selection Recommendations
Choose Ubuntu ARM: For rapid deployment of edge AI applications (e.g., vision detection on Jetson) or deep integration with public clouds (e.g., AWS IoT Greengrass).
Choose Debian ARM: For mission-critical industrial equipment (e.g., substation monitoring) where stability outweighs feature novelty.
Choose Yocto Project: For custom hardware development (e.g., proprietary industrial boards) or strict real-time/safety certification (e.g., ISO 13849) requirements.
6. Hybrid Architecture Example
Smart factory edge node:
Real-time control layer: RTOS built with Yocto (controlling robotic arms)
Data processing layer: Debian running OPC UA servers
Cloud connectivity layer: Ubuntu Server managing K8s edge clusters
Combining these systems based on specific needs can maximize the efficiency of IIoT edge computing.
0 notes
Text
Effective Kubernetes cluster monitoring simplifies containerized workload management by measuring uptime, resource use (such as memory, CPU, and storage), and interaction between cluster components. It also enables cluster managers to monitor the cluster and discover issues such as inadequate resources, errors, pods that fail to start, and nodes that cannot join the cluster. Essentially, Kubernetes monitoring enables you to discover issues and manage Kubernetes clusters more proactively. What Kubernetes Metrics Should You Measure? Monitoring Kubernetes metrics is critical for ensuring the reliability, performance, and efficiency of applications in a Kubernetes cluster. Because Kubernetes constantly expands and maintains containers, measuring critical metrics allows you to spot issues early on, optimize resource allocation, and preserve overall system integrity. Several factors are critical to watch with Kubernetes: Cluster monitoring - Monitors the health of the whole Kubernetes cluster. It helps you find out how many apps are running on a node, if it is performing efficiently and at the right capacity, and how much resource the cluster requires overall. Pod monitoring - Tracks issues impacting individual pods, including resource use, application metrics, and pod replication or auto scaling metrics. Ingress metrics - Monitoring ingress traffic can help in discovering and managing a variety of issues. Using controller-specific methods, ingress controllers can be set up to track network traffic information and workload health. Persistent storage - Monitoring volume health allows Kubernetes to implement CSI. You can also use the external health monitor controller to track node failures. Control plane metrics - With control plane metrics we can track and visualize cluster performance while troubleshooting by keeping an eye on schedulers, controllers, and API servers. Node metrics - Keeping an eye on each Kubernetes node's CPU and memory usage might help ensure that they never run out. A running node's status can be defined by a number of conditions, such as Ready, MemoryPressure, DiskPressure, OutOfDisk, and NetworkUnavailable. Monitoring and Troubleshooting Kubernetes Clusters Using the Kubernetes Dashboard The Kubernetes dashboard is a web-based user interface for Kubernetes. It allows you to deploy containerized apps to a Kubernetes cluster, see an overview of the applications operating on the cluster, and manage cluster resources. Additionally, it enables you to: Debug containerized applications by examining data on the health of your Kubernetes cluster's resources, as well as any anomalies that have occurred. Create and modify individual Kubernetes resources, including deployments, jobs, DaemonSets, and StatefulSets. Have direct control over your Kubernetes environment using the Kubernetes dashboard. The Kubernetes dashboard is built into Kubernetes by default and can be installed and viewed from the Kubernetes master node. Once deployed, you can visit the dashboard via a web browser to examine extensive information about your Kubernetes cluster and conduct different operations like scaling deployments, establishing new resources, and updating application configurations. Kubernetes Dashboard Essential Features Kubernetes Dashboard comes with some essential features that help manage and monitor your Kubernetes clusters efficiently: Cluster overview: The dashboard displays information about your Kubernetes cluster, including the number of nodes, pods, and services, as well as the current CPU and memory use. Resource management: The dashboard allows you to manage Kubernetes resources, including deployments, services, and pods. You can add, update, and delete resources while also seeing extensive information about them. Application monitoring: The dashboard allows you to monitor the status and performance of Kubernetes-based apps. You may see logs and stats, fix issues, and set alarms.
Customizable views: The dashboard allows you to create and preserve bespoke dashboards with the metrics and information that are most essential to you. Kubernetes Monitoring Best Practices Here are some recommended practices to help you properly monitor and debug Kubernetes installations: 1. Monitor Kubernetes Metrics Kubernetes microservices require understanding granular resource data like memory, CPU, and load. However, these metrics may be complex and challenging to leverage. API indicators such as request rate, call error, and latency are the most effective KPIs for identifying service faults. These metrics can immediately identify degradations in a microservices application's components. 2. Ensure Monitoring Systems Have Enough Data Retention Having scalable monitoring solutions helps you to efficiently monitor your Kubernetes cluster as it grows and evolves over time. As your Kubernetes cluster expands, so will the quantity of data it creates, and your monitoring systems must be capable of handling this rise. If your systems are not scalable, they may get overwhelmed by the volume of data and be unable to offer accurate or relevant results. 3. Integrate Monitoring Systems Into Your CI/CD Pipeline Source Integrating Kubernetes monitoring solutions with CI/CD pipelines enables you to monitor your apps and infrastructure as they are deployed, rather than afterward. By connecting your monitoring systems to your pipeline for continuous integration and delivery (CI/CD), you can automatically collect and process data from your infrastructure and applications as it is delivered. This enables you to identify potential issues early on and take action to stop them from getting worse. 4. Create Alerts You may identify the problems with your Kubernetes cluster early on and take action to fix them before they get worse by setting up the right alerts. For example, if you configure alerts for crucial metrics like CPU or memory use, you will be informed when those metrics hit specific thresholds, allowing you to take action before your cluster gets overwhelmed. Conclusion Kubernetes allows for the deployment of a large number of containerized applications within its clusters, each of which has nodes that manage the containers. Efficient observability across various machines and components is critical for successful Kubernetes container orchestration. Kubernetes has built-in monitoring facilities for its control plane, but they may not be sufficient for thorough analysis and granular insight into application workloads, event logging, and other microservice metrics within Kubernetes clusters.
0 notes
Text
Trending Cloud Services to Consider in 2025
The cloud services landscape is evolving rapidly, offering businesses innovative solutions to enhance productivity and efficiency. Here are some trending cloud services that organizations should consider incorporating into their strategies this year.
For those looking to enhance their skills, Cloud Computing Course With Placement programs offer comprehensive education and job placement assistance, making it easier to master this tool and advance your career.
1. Serverless Computing
AWS Lambda
Serverless computing allows developers to run code without provisioning or managing servers. AWS Lambda is leading the way, enabling businesses to focus on application logic rather than infrastructure management. This approach reduces costs and accelerates deployment times.
Azure Functions
Similar to AWS Lambda, Azure Functions offers event-driven serverless computing. It integrates seamlessly with other Azure services, making it ideal for businesses utilizing the Microsoft ecosystem.
2. Multi-Cloud Solutions
IBM Multicloud Management
As more organizations adopt multi-cloud strategies, services like IBM Multicloud Management facilitate the management of applications across multiple cloud environments. This flexibility helps businesses avoid vendor lock-in and optimize costs.
Google Anthos
Google Anthos enables organizations to manage applications across on-premises and cloud environments. Its ability to run Kubernetes clusters consistently across platforms makes it a powerful tool for hybrid cloud strategies.
3. AI and Machine Learning Services
Azure Machine Learning
With the growing importance of data-driven decision-making, Azure Machine Learning provides robust tools for building, training, and deploying machine learning models. Its user-friendly interface allows businesses to leverage AI without extensive technical expertise.
Google AI Platform
Google’s AI Platform supports businesses in developing their AI applications. From data preparation to model deployment, it offers comprehensive solutions tailored to various industries.
It’s simpler to master this tool and progress your profession with the help of Best Online Training & Placement programs, which provide thorough instruction and job placement support to anyone seeking to improve their talents.

4. Cloud Security Solutions
Palo Alto Networks Prisma Cloud
As cyber threats evolve, robust cloud security solutions are essential. Prisma Cloud provides comprehensive security for cloud-native applications and protects against vulnerabilities across multi-cloud environments.
Cloudflare Zero Trust
Cloudflare’s Zero Trust security model ensures that access is granted based on user identity and device security rather than network location. This approach enhances security in today’s remote work environment.
5. Collaborative Tools
Microsoft Teams
As remote work continues to be a norm, Microsoft Teams has emerged as a leading collaborative platform. Its integration with Microsoft 365 allows for seamless communication and collaboration among teams.
Slack
Slack remains a favorite for team communication, offering various integrations that enhance productivity. Its user-friendly interface and ability to streamline workflows make it essential for modern businesses.
6. Data Analytics Platforms
Tableau
Tableau is a powerful analytics platform that allows businesses to visualize data and gain insights. Its cloud capabilities enable teams to collaborate on data analysis in real-time.
Looker
Part of Google Cloud, Looker offers robust data analytics and business intelligence solutions. Its ability to integrate with various data sources makes it ideal for businesses looking to derive actionable insights from their data.
Conclusion
In 2025, these trending cloud services are set to redefine how businesses operate and innovate. By adopting serverless computing, multi-cloud solutions, AI services, and enhanced security measures, organizations can stay competitive in an ever-evolving landscape. Embracing these technologies will not only streamline operations but also empower businesses to make data-driven decisions for future growth. Stay ahead of the curve by considering these cloud services as you plan for the year ahead!
0 notes
Text
How Kubernetes Cluster Sizing Affects Performance and Cost Efficiency in Cloud Deployments
http://securitytc.com/TKtKtH
0 notes
Text
The Unseen Power of Linux System Infrastructure: Beyond the Conventional Wisdom
Introduction: Not Just Another Server
When people talk about Linux servers, the conversation often revolves around the obvious. They mention reliability, open-source flexibility, security, and cost-efficiency. But the true essence of Linux servers goes far deeper than just technical specifications and traditional arguments. To understand Linux servers is to understand a philosophy, a movement, and a way of rethinking digital sovereignty. It's not just about running code; it's about choosing freedom, performance, and evolution.
A Living, Breathing Ecosystem
Unlike static operating systems that are updated occasionally by monolithic corporations, Linux servers are part of a vibrant, dynamic, and self-healing ecosystem. Each distribution is a living entity, shaped by communities across the globe, evolving with the needs of real users, developers, and businesses. It is not just software installed on a machine; it is a living organism constantly adapting, optimizing, and innovating. Linux servers do not wait for permission from a central authority to grow; they evolve organically, driven by necessity and passion.
The Philosophy of Choice and Control
Linux servers offer a depth of customization and control that no proprietary system can match. Every decision, from the kernel level to the user space, is yours to make. It forces you to engage with your infrastructure on a deeper level. This engagement creates a symbiotic relationship between the user and the machine. Running a Linux server is not merely about deploying an application; it's about architecting an environment tailored to your precise needs. This level of granular control cultivates a mindset of precision, intentionality, and mastery.
Security Through Transparency
While other systems rely heavily on obscurity and corporate security teams, Linux servers achieve unparalleled security through radical transparency. Every line of code is available for inspection, every vulnerability can be scrutinized by thousands of independent eyes. This isn't just about patching CVEs faster; it's about creating a fundamentally more secure environment through collective vigilance. A Linux server is not a black box; it’s an open book written in real-time by the world’s finest minds.
Resilience in the Face of Adversity
There is a reason why the world’s most critical infrastructure — from financial markets to space exploration — trusts Linux servers. It’s not just about uptime; it’s about resilience. When chaos hits, when unexpected failures cascade, Linux servers offer the kind of composure and recoverability that closed systems simply cannot. Thanks to tools like system snapshots, redundant configurations, and scriptable recovery processes, Linux servers embody a philosophy of survival, adaptability, and engineering for the worst-case scenario.
The True Cost of Ownership
It's easy to highlight that Linux is "free," but that's a shallow way to view its economic advantage. The true cost of a server lies in maintenance, downtime, scalability, and flexibility over time. Linux servers win because they minimize these hidden costs. Their modularity means you can optimize precisely what you need, without paying for bloated software features. Their massive global community means faster troubleshooting and innovation. In the long run, Linux servers don’t just save money — they enable you to reinvest in growth rather than firefighting.
Empowering Innovation and Experimentation
A Linux server is not just a platform for hosting websites or applications. It is a playground for innovation. Want to build a Kubernetes cluster from scratch? Set up a cutting-edge AI environment? Automate complex data pipelines? With Linux, the only limit is your ambition. The open nature of the ecosystem encourages experimentation without penalty. Mistakes are learning opportunities, not costly failures. Every reboot, every configuration tweak, every successful deployment turns you from a consumer of technology into a creator.
The Silent Backbone of the Internet
Every day, billions of people interact with Linux servers without even knowing it. They browse websites, stream videos, communicate across continents — all thanks to infrastructures powered invisibly by Linux. It's the silent workhorse that holds up the modern digital world. Even companies that build proprietary platforms often rely on Linux servers at their core. They don't advertise it, but behind every major cloud provider, every massive database, every seamless user experience, there is likely a Linux box humming quietly in a data center.
Cultural Movement, Not Just Technology
To run Linux servers is to align yourself with a culture that values openness, community, and empowerment. This is a culture that believes in giving back, in documenting knowledge, in challenging monopolies, and in pushing the boundaries of what’s possible. Using Linux is not just a technical choice; it is a philosophical one. It says that you value collaboration over competition, transparency over secrecy, and innovation over stagnation.
From Hobbyist to Enterprise: A Universal Language
What’s fascinating about Linux servers rackset is their universal appeal. A teenager learning to code in their bedroom and a Fortune 500 company building multi-region high-availability clusters are both speaking the same language. The barrier to entry is low, but the ceiling for growth is limitless. You can start with a simple VPS and end up architecting complex, distributed systems that span continents — all within the same ecosystem. Linux grows with you, matching your pace, your curiosity, and your ambition.
Future-Proofing Your Career and Your Business
Betting on Linux is betting on the future. With the explosion of cloud computing, DevOps, AI, blockchain, and edge computing, Linux expertise is becoming not just valuable but essential. Businesses that invest in Linux-based infrastructures future-proof themselves against technological obsolescence. Professionals who master Linux servers position themselves at the bleeding edge of innovation, equipped to handle the next generation of technological challenges with confidence.
Conclusion: The Choice That Defines You
Choosing to run Linux servers is not just a technical decision. It is a declaration of independence, a commitment to mastery, a vote for a better digital world. It is a journey from user to creator, from consumer to architect. In a world increasingly defined by opaque systems and centralized control, Linux servers offer a rare gift: transparency, autonomy, and limitless potential. To choose Linux is to choose to stand on the shoulders of giants — and to build something even greater.
0 notes
Text
Master Multicluster Kubernetes with DO480: Red Hat OpenShift Platform Plus Training
In today’s enterprise landscape, managing multiple Kubernetes clusters across hybrid or multi-cloud environments is no longer optional — it’s essential. Whether you’re scaling applications globally, ensuring high availability, or meeting regulatory compliance, multicluster management is the key to consistent, secure, and efficient operations.
That’s where Red Hat OpenShift Platform Plus and the DO480 course come in.
🔍 What is DO480?
DO480: Multicluster Management with Red Hat OpenShift Platform Plus is an advanced, hands-on course designed for platform engineers, cluster admins, and DevOps teams. It teaches how to manage and secure Kubernetes clusters at scale using Red Hat’s enterprise-grade tools like:
Red Hat Advanced Cluster Management (ACM) for Kubernetes
Red Hat Advanced Cluster Security (ACS) for Kubernetes
OpenShift GitOps and Pipelines
Multi-cluster observability
📌 Why Should You Learn DO480?
As enterprises adopt hybrid and multi-cloud strategies, the complexity of managing Kubernetes clusters increases. DO480 equips you with the skills to:
✅ Deploy, govern, and automate multiple clusters ✅ Apply security policies consistently across all clusters ✅ Gain centralized visibility into workloads, security posture, and compliance ✅ Use GitOps workflows to streamline multicluster deployments ✅ Automate Day-2 operations like backup, disaster recovery, and patch management
👨💻 What Will You Learn?
The DO480 course covers key topics, including:
Installing and configuring Red Hat ACM
Creating and managing cluster sets, placement rules, and application lifecycle
Using OpenShift GitOps for declarative deployment
Integrating ACS for runtime and build-time security
Enforcing policies and handling compliance at scale
All these are practiced through hands-on labs in a real-world environment.
🎯 Who Should Attend?
This course is ideal for:
Platform engineers managing multiple clusters
DevOps professionals building GitOps-based automation
Security teams enforcing policies across cloud-native environments
Anyone aiming to become a Red Hat Certified Specialist in Multicluster Management
🔒 Certification Path
Completing DO480 helps prepare you for the Red Hat Certified Specialist in Multicluster Management exam — a valuable addition to your Red Hat Certified Architect (RHCA) journey.
🚀 Ready to Master Multicluster Kubernetes? Enroll in DO480 – Multicluster Management with Red Hat OpenShift Platform Plus and gain the skills needed to control, secure, and scale your OpenShift environment like a pro.
🔗 Talk to HawkStack today to schedule your corporate or individual training. 🌐 www.hawkstack.com
0 notes
Text
Machine Learning Infrastructure: The Foundation of Scalable AI Solutions

Introduction: Why Machine Learning Infrastructure Matters
In today's digital-first world, the adoption of artificial intelligence (AI) and machine learning (ML) is revolutionizing every industry—from healthcare and finance to e-commerce and entertainment. However, while many organizations aim to leverage ML for automation and insights, few realize that success depends not just on algorithms, but also on a well-structured machine learning infrastructure.
Machine learning infrastructure provides the backbone needed to deploy, monitor, scale, and maintain ML models effectively. Without it, even the most promising ML solutions fail to meet their potential.
In this comprehensive guide from diglip7.com, we’ll explore what machine learning infrastructure is, why it’s crucial, and how businesses can build and manage it effectively.
What is Machine Learning Infrastructure?
Machine learning infrastructure refers to the full stack of tools, platforms, and systems that support the development, training, deployment, and monitoring of ML models. This includes:
Data storage systems
Compute resources (CPU, GPU, TPU)
Model training and validation environments
Monitoring and orchestration tools
Version control for code and models
Together, these components form the ecosystem where machine learning workflows operate efficiently and reliably.
Key Components of Machine Learning Infrastructure
To build robust ML pipelines, several foundational elements must be in place:
1. Data Infrastructure
Data is the fuel of machine learning. Key tools and technologies include:
Data Lakes & Warehouses: Store structured and unstructured data (e.g., AWS S3, Google BigQuery).
ETL Pipelines: Extract, transform, and load raw data for modeling (e.g., Apache Airflow, dbt).
Data Labeling Tools: For supervised learning (e.g., Labelbox, Amazon SageMaker Ground Truth).
2. Compute Resources
Training ML models requires high-performance computing. Options include:
On-Premise Clusters: Cost-effective for large enterprises.
Cloud Compute: Scalable resources like AWS EC2, Google Cloud AI Platform, or Azure ML.
GPUs/TPUs: Essential for deep learning and neural networks.
3. Model Training Platforms
These platforms simplify experimentation and hyperparameter tuning:
TensorFlow, PyTorch, Scikit-learn: Popular ML libraries.
MLflow: Experiment tracking and model lifecycle management.
KubeFlow: ML workflow orchestration on Kubernetes.
4. Deployment Infrastructure
Once trained, models must be deployed in real-world environments:
Containers & Microservices: Docker, Kubernetes, and serverless functions.
Model Serving Platforms: TensorFlow Serving, TorchServe, or custom REST APIs.
CI/CD Pipelines: Automate testing, integration, and deployment of ML models.
5. Monitoring & Observability
Key to ensure ongoing model performance:
Drift Detection: Spot when model predictions diverge from expected outputs.
Performance Monitoring: Track latency, accuracy, and throughput.
Logging & Alerts: Tools like Prometheus, Grafana, or Seldon Core.
Benefits of Investing in Machine Learning Infrastructure
Here’s why having a strong machine learning infrastructure matters:
Scalability: Run models on large datasets and serve thousands of requests per second.
Reproducibility: Re-run experiments with the same configuration.
Speed: Accelerate development cycles with automation and reusable pipelines.
Collaboration: Enable data scientists, ML engineers, and DevOps to work in sync.
Compliance: Keep data and models auditable and secure for regulations like GDPR or HIPAA.
Real-World Applications of Machine Learning Infrastructure
Let’s look at how industry leaders use ML infrastructure to power their services:
Netflix: Uses a robust ML pipeline to personalize content and optimize streaming.
Amazon: Trains recommendation models using massive data pipelines and custom ML platforms.
Tesla: Collects real-time driving data from vehicles and retrains autonomous driving models.
Spotify: Relies on cloud-based infrastructure for playlist generation and music discovery.
Challenges in Building ML Infrastructure
Despite its importance, developing ML infrastructure has its hurdles:
High Costs: GPU servers and cloud compute aren't cheap.
Complex Tooling: Choosing the right combination of tools can be overwhelming.
Maintenance Overhead: Regular updates, monitoring, and security patching are required.
Talent Shortage: Skilled ML engineers and MLOps professionals are in short supply.
How to Build Machine Learning Infrastructure: A Step-by-Step Guide
Here’s a simplified roadmap for setting up scalable ML infrastructure:
Step 1: Define Use Cases
Know what problem you're solving. Fraud detection? Product recommendations? Forecasting?
Step 2: Collect & Store Data
Use data lakes, warehouses, or relational databases. Ensure it’s clean, labeled, and secure.
Step 3: Choose ML Tools
Select frameworks (e.g., TensorFlow, PyTorch), orchestration tools, and compute environments.
Step 4: Set Up Compute Environment
Use cloud-based Jupyter notebooks, Colab, or on-premise GPUs for training.
Step 5: Build CI/CD Pipelines
Automate model testing and deployment with Git, Jenkins, or MLflow.
Step 6: Monitor Performance
Track accuracy, latency, and data drift. Set alerts for anomalies.
Step 7: Iterate & Improve
Collect feedback, retrain models, and scale solutions based on business needs.
Machine Learning Infrastructure Providers & Tools
Below are some popular platforms that help streamline ML infrastructure: Tool/PlatformPurposeExampleAmazon SageMakerFull ML development environmentEnd-to-end ML pipelineGoogle Vertex AICloud ML serviceTraining, deploying, managing ML modelsDatabricksBig data + MLCollaborative notebooksKubeFlowKubernetes-based ML workflowsModel orchestrationMLflowModel lifecycle trackingExperiments, models, metricsWeights & BiasesExperiment trackingVisualization and monitoring
Expert Review
Reviewed by: Rajeev Kapoor, Senior ML Engineer at DataStack AI
"Machine learning infrastructure is no longer a luxury; it's a necessity for scalable AI deployments. Companies that invest early in robust, cloud-native ML infrastructure are far more likely to deliver consistent, accurate, and responsible AI solutions."
Frequently Asked Questions (FAQs)
Q1: What is the difference between ML infrastructure and traditional IT infrastructure?
Answer: Traditional IT supports business applications, while ML infrastructure is designed for data processing, model training, and deployment at scale. It often includes specialized hardware (e.g., GPUs) and tools for data science workflows.
Q2: Can small businesses benefit from ML infrastructure?
Answer: Yes, with the rise of cloud platforms like AWS SageMaker and Google Vertex AI, even startups can leverage scalable machine learning infrastructure without heavy upfront investment.
Q3: Is Kubernetes necessary for ML infrastructure?
Answer: While not mandatory, Kubernetes helps orchestrate containerized workloads and is widely adopted for scalable ML infrastructure, especially in production environments.
Q4: What skills are needed to manage ML infrastructure?
Answer: Familiarity with Python, cloud computing, Docker/Kubernetes, CI/CD, and ML frameworks like TensorFlow or PyTorch is essential.
Q5: How often should ML models be retrained?
Answer: It depends on data volatility. In dynamic environments (e.g., fraud detection), retraining may occur weekly or daily. In stable domains, monthly or quarterly retraining suffices.
Final Thoughts
Machine learning infrastructure isn’t just about stacking technologies—it's about creating an agile, scalable, and collaborative environment that empowers data scientists and engineers to build models with real-world impact. Whether you're a startup or an enterprise, investing in the right infrastructure will directly influence the success of your AI initiatives.
By building and maintaining a robust ML infrastructure, you ensure that your models perform optimally, adapt to new data, and generate consistent business value.
For more insights and updates on AI, ML, and digital innovation, visit diglip7.com.
0 notes
Text
Kubernetes vs. Traditional Infrastructure: Why Clusters and Pods Win
In today’s fast-paced digital landscape, agility, scalability, and reliability are not just nice-to-haves—they’re necessities. Traditional infrastructure, once the backbone of enterprise computing, is increasingly being replaced by cloud-native solutions. At the forefront of this transformation is Kubernetes, an open-source container orchestration platform that has become the gold standard for managing containerized applications.
But what makes Kubernetes a superior choice compared to traditional infrastructure? In this article, we’ll dive deep into the core differences, and explain why clusters and pods are redefining modern application deployment and operations.
Understanding the Fundamentals
Before drawing comparisons, it’s important to clarify what we mean by each term:
Traditional Infrastructure
This refers to monolithic, VM-based environments typically managed through manual or semi-automated processes. Applications are deployed on fixed servers or VMs, often with tight coupling between hardware and software layers.
Kubernetes
Kubernetes abstracts away infrastructure by using clusters (groups of nodes) to run pods (the smallest deployable units of computing). It automates deployment, scaling, and operations of application containers across clusters of machines.
Key Comparisons: Kubernetes vs Traditional Infrastructure
Feature
Traditional Infrastructure
Kubernetes
Scalability
Manual scaling of VMs; slow and error-prone
Auto-scaling of pods and nodes based on load
Resource Utilization
Inefficient due to over-provisioning
Efficient bin-packing of containers
Deployment Speed
Slow and manual (e.g., SSH into servers)
Declarative deployments via YAML and CI/CD
Fault Tolerance
Rigid failover; high risk of downtime
Self-healing, with automatic pod restarts and rescheduling
Infrastructure Abstraction
Tightly coupled; app knows about the environment
Decoupled; Kubernetes abstracts compute, network, and storage
Operational Overhead
High; requires manual configuration, patching
Low; centralized, automated management
Portability
Limited; hard to migrate across environments
High; deploy to any Kubernetes cluster (cloud, on-prem, hybrid)
Why Clusters and Pods Win
1. Decoupled Architecture
Traditional infrastructure often binds application logic tightly to specific servers or environments. Kubernetes promotes microservices and containers, isolating app components into pods. These can run anywhere without knowing the underlying system details.
2. Dynamic Scaling and Scheduling
In a Kubernetes cluster, pods can scale automatically based on real-time demand. The Horizontal Pod Autoscaler (HPA) and Cluster Autoscaler help dynamically adjust resources—unthinkable in most traditional setups.
3. Resilience and Self-Healing
Kubernetes watches your workloads continuously. If a pod crashes or a node fails, the system automatically reschedules the workload on healthy nodes. This built-in self-healing drastically reduces operational overhead and downtime.
4. Faster, Safer Deployments
With declarative configurations and GitOps workflows, teams can deploy with speed and confidence. Rollbacks, canary deployments, and blue/green strategies are natively supported—streamlining what’s often a risky manual process in traditional environments.
5. Unified Management Across Environments
Whether you're deploying to AWS, Azure, GCP, or on-premises, Kubernetes provides a consistent API and toolchain. No more re-engineering apps for each environment—write once, run anywhere.
Addressing Common Concerns
“Kubernetes is too complex.”
Yes, Kubernetes has a learning curve. But its complexity replaces operational chaos with standardized automation. Tools like Helm, ArgoCD, and managed services (e.g., GKE, EKS, AKS) help simplify the onboarding process.
“Traditional infra is more secure.”
Security in traditional environments often depends on network perimeter controls. Kubernetes promotes zero trust principles, pod-level isolation, and RBAC, and integrates with service meshes like Istio for granular security policies.
Real-World Impact
Companies like Spotify, Shopify, and Airbnb have migrated from legacy infrastructure to Kubernetes to:
Reduce infrastructure costs through efficient resource utilization
Accelerate development cycles with DevOps and CI/CD
Enhance reliability through self-healing workloads
Enable multi-cloud strategies and avoid vendor lock-in
Final Thoughts
Kubernetes is more than a trend—it’s a foundational shift in how software is built, deployed, and operated. While traditional infrastructure served its purpose in a pre-cloud world, it can’t match the agility and scalability that Kubernetes offers today.
Clusters and pods don’t just win—they change the game.
0 notes
Text
Security and Compliance in Cloud Deployments: A Proactive DevOps Approach
As cloud computing becomes the backbone of modern digital infrastructure, organizations are increasingly migrating applications and data to the cloud for agility, scalability, and cost-efficiency. However, this shift also brings elevated risks around security and compliance. To ensure safety and regulatory alignment, companies must adopt a proactive DevOps approach that integrates security into every stage of the development lifecycle—commonly referred to as DevSecOps.
Why Security and Compliance Matter in the Cloud
Cloud environments are dynamic and complex. Without the proper controls in place, they can easily become vulnerable to data breaches, configuration errors, insider threats, and compliance violations. Unlike traditional infrastructure, cloud-native deployments are continuously evolving, which requires real-time security measures and automated compliance enforcement.
Neglecting these areas can lead to:
Financial penalties for regulatory violations (GDPR, HIPAA, SOC 2, etc.)
Data loss and reputation damage
Business continuity risks due to breaches or downtime
The Role of DevOps in Cloud Security
DevOps is built around principles of automation, collaboration, and continuous delivery. By extending these principles to include security (DevSecOps), teams can ensure that infrastructure and applications are secure from the ground up, rather than bolted on as an afterthought.
A proactive DevOps approach focuses on:
Shift-Left Security: Security checks are moved earlier in the development process to catch issues before deployment.
Continuous Compliance: Policies are codified and integrated into CI/CD pipelines to maintain adherence to industry standards automatically.
Automated Risk Detection: Real-time scanning tools identify vulnerabilities, misconfigurations, and policy violations continuously.
Infrastructure as Code (IaC) Security: IaC templates are scanned for compliance and security flaws before provisioning cloud infrastructure.
Key Components of a Proactive Cloud Security Strategy
Identity and Access Management (IAM): Ensure least-privilege access using role-based policies and multi-factor authentication.
Encryption: Enforce encryption of data both at rest and in transit using cloud-native tools and third-party integrations.
Vulnerability Scanning: Use automated scanners to check applications, containers, and VMs for known security flaws.
Compliance Monitoring: Track compliance posture continuously against frameworks such as ISO 27001, PCI-DSS, and NIST.
Logging and Monitoring: Centralized logging and anomaly detection help detect threats early and support forensic investigations.
Secrets Management: Store and manage credentials, tokens, and keys using secure vaults.
Best Practices for DevSecOps in the Cloud
Integrate Security into CI/CD Pipelines: Use tools like Snyk, Aqua, and Checkov to run security checks automatically.
Perform Regular Threat Modeling: Continuously assess evolving attack surfaces and prioritize high-impact risks.
Automate Patch Management: Ensure all components are regularly updated and unpatched vulnerabilities are minimized.
Enable Policy as Code: Define and enforce compliance rules through version-controlled code in your DevOps pipeline.
Train Developers and Engineers: Security is everyone’s responsibility—conduct regular security training and awareness sessions.
How Salzen Cloud Ensures Secure Cloud Deployments
At Salzen Cloud, we embed security and compliance at the core of our cloud solutions. Our team works with clients to develop secure-by-design architectures that incorporate DevSecOps principles from planning to production. Whether it's automating compliance reports, hardening Kubernetes clusters, or configuring IAM policies, we ensure cloud operations are secure, scalable, and audit-ready.
Conclusion
In the era of cloud-native applications, security and compliance can no longer be reactive. A proactive DevOps approach ensures that every component of your cloud environment is secure, compliant, and continuously monitored. By embedding security into CI/CD workflows and automating compliance checks, organizations can mitigate risks while maintaining development speed.
Partner with Salzen Cloud to build secure and compliant cloud infrastructures with confidence.
0 notes